
Student Success Metrics: What factors Impact college GPA?
Have you ever wondered to what extent does missing class, having a job, alcohol consumption, GPA and ACT score have on one’s college GPA? This research topic is useful for both students and universities, as understanding what affects student GPA could help schools create stronger support systems to improve student success and academic performance. Identifying which variables have the highest correlation with GPA could help students know what changes they should make in order to strengthen their grades. Furthermore, looking at ACT score compared to GPA shows how well standardized test scores predict academic success in college.
Based on our regression, we found that the number of classes skipped and having an above-average ACT score are the two variables most strongly related to a student’s college GPA. In our model, every additional class skipped per week is associated with about a 0.10 point decrease in college GPA, and this coefficient is statistically significant. Moreover, having a high ACT score is associated with about a 0.16 point increase in college GPA, and this coefficient is also statistically significant, which suggests that prior academic preparation measured by standardized tests is an important factor for college performance. However, working 20 or more hours per week, being male, and drinking alcohol have small coefficients and are not statistically significant, so we do not find strong evidence that they are related to GPA for our sample. Overall, the R² of our regression is 0.1342, meaning that our explanatory variables skipped, alcohol, job20, male, and highACT together explain about 13% of the variation in college GPA.
We view these findings as correlations rather than causal relationships, due to the fact that our data comes from a cross-sectional survey, and we do not randomly assign students to skip classes, work a certain number of hours, or drink alcohol more times per week. There are many omitted variables, such as motivation, time management, socioeconomic status, cultural background, or a student’s major and coursework, all of which are not being considered in our dataset and could affect both their college GPA and our explanatory variables. Because of these limitations, our estimates show how our variables are associated with college GPA in this sample, but they do not prove that changing one of these variables would directly cause a specific change in a student’s grades.
Previous research has already investigated the relationship between attendance, work, and high school academics related to college grades. One study that examined first-year students at Qatar University found that both class attendance and high school GPA are strong predictors of academic success. Higher class attendance and high school performance lower the probability of receiving a D, F, or withdrawing from a course. Their study also shows that high school GPA is usually a better predictor of college performance instead of standardized test scores, which means that tests like the ACT or SAT add some information but are not as powerful as a student's GPA itself.
Other work has focused on alcohol use and health behaviors as determinants of academic performance. El Ansari, Stock and Mills study how different measures of alcohol consumption, such as frequency of drinking, heavy drinking, and problem drinking relate to how important students say good grades are, how they rate their own performance compared to their peers, and their actual grades. They find that heavier drinking is associated with lower motivation for good grades and worse self-rated performance. This aligns with our choice to examine how the frequency of drinking is related to a student’s grades. DeMartini’s thesis studies how health can impact GPA, stating that overall better health is associated with higher academic success. He not only examines health variables, but also takes into consideration a student’s high school achievements, SAT scores, and previous college grades, all of which match our decision to study the impacts of high ACT scores and skipped classes in a student’s college GPA.
We are investigating the effect of gender, attendance, working a job, alcohol consumption, and ACT score on college GPA. To answer this question, we are using the dataset GPA1 from Wooldridge data sets with cross-sectional individual data. It includes information on 141 college students (n=141) with variables related to academics, personal background, and lifestyle. The dependent variable we will be looking at is college GPA (colGPA). The numerical explanatory variables we are using are the average number of lectures missed per week (skipped) and the average number of days per week that the student drinks alcohol (alcohol). Our first dummy explanatory variable we are using is if the student works 20 or more hours per week (job20=0 if the student works less than 20 hours per week, job20=1 if the student works 20 or more hours per week). Our second dummy explanatory variable we are using is if the student is male (male=0 if the student is female, male=1 if the student is male). We are also creating the dummy variable highACT to investigate if having an above average ACT score is correlated to college GPA (highACT=0 if ACT is less than 24.15603, highACT=1 if ACT is greater than or equal to 24.15603).
As shown in Table 1, the mean college GPA (colGPA) for students in the sample is approximately 3.06, which corresponds to a B average in most universities. The mean number of lectures skipped per week (skipped) is 1.08, meaning that on average, students miss about one class each week. The average alcohol consumption (alcohol) is 1.9 days per week, suggesting that students typically drink on weekends. Roughly 17% of students work 20 or more hours per week (job20 = 1), which aligns with expectations since most undergraduates only work part-time or hold on-campus jobs. The proportion of male students (male = 1) is 52.5%, close to an even gender balance, which is typical for college populations. Finally, about 40% of students have an above-average ACT score (highACT = 1), where the cutoff value of 24.15603 was determined using the Stata command summarize ACT. These descriptive results provide an overview of the main variables used in the analysis and help contextualize later comparisons between academic performance and these characteristics.
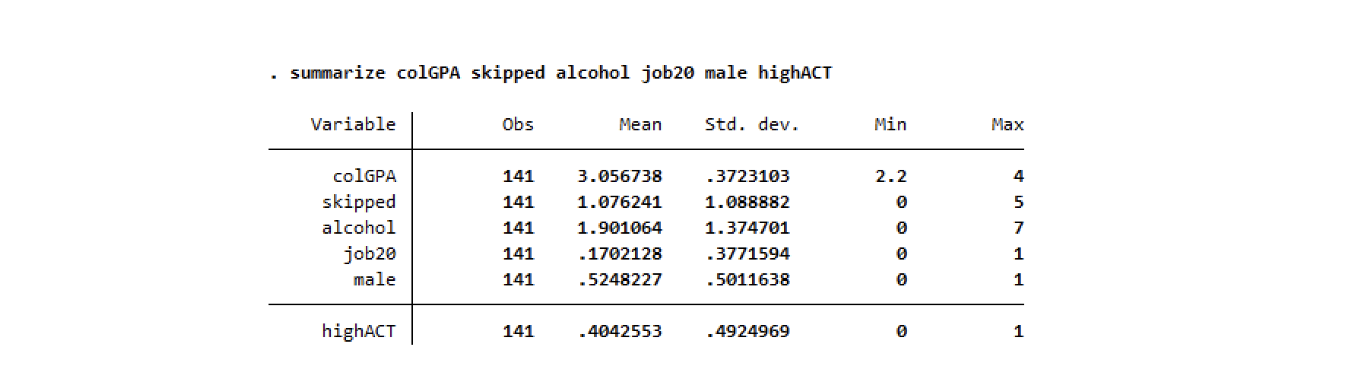
Table 1. Summary Statistics
Furthermore as demonstrated in Table 2, the mean college GPA (colGPA) is 3.06, while the median is 3.0. The fact that these two measures are nearly identical indicates that the data are fairly symmetric and that there are no strong outliers pulling the mean significantly in either direction. Although a few students have very high GPAs (up to 4.0) and very low GPAs (as low as 2.2), these extreme values seem to balance each other out. This supports the idea that most students in the sample perform around the average level, with only minor variation in academic performance.
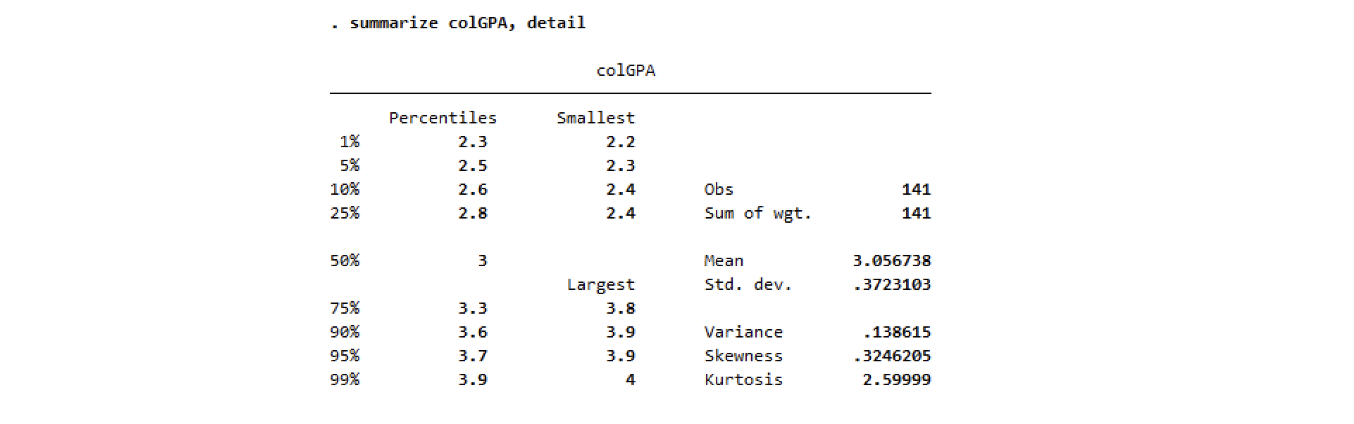
Table 2. College GPA statistics
The distribution of colGPA appears roughly normal overall, since the mean and the median are both the same, with most students clustering around 3.0. However, there is a noticeable drop in frequency just after the 3.0 threshold. This may be due to the fact that many students aim to maintain at least a 3.0 GPA, which is evident in the upward trend leading up to that point. Once students reach this benchmark, fewer seem to push beyond it. As a result, GPAs slightly above 3.0 are less common because many are satisfied with meeting that academic standard.
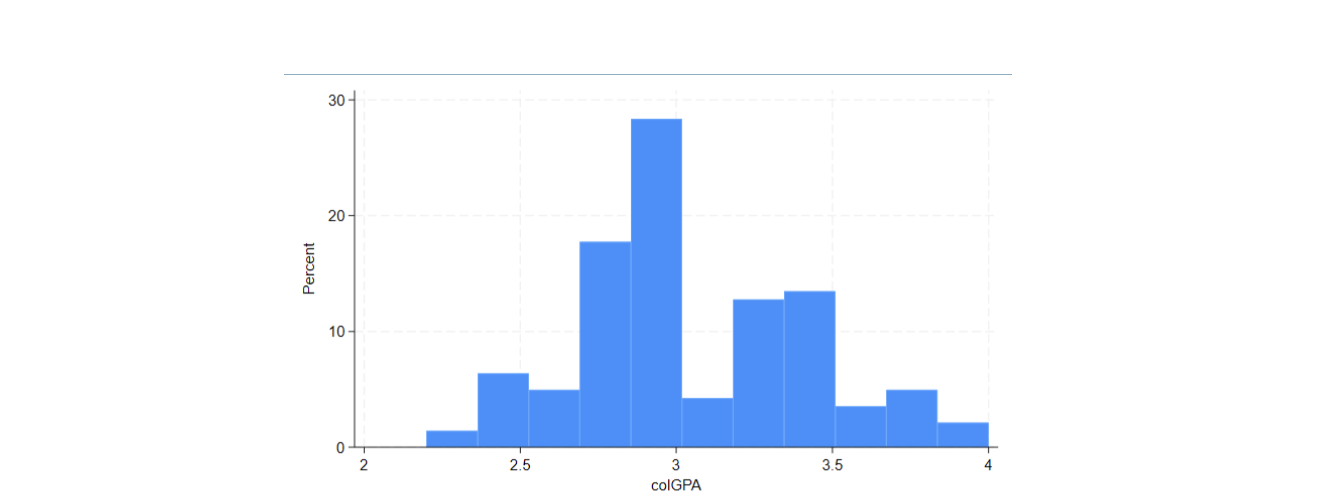
Figure 1. College GPA histogram (percent)
Students who work fewer than 20 hours per week tend to have slightly higher GPAs than those who work longer hours. As seen in Table 3, students working under 20 hours report an average GPA of 3.07, compared to 3.00 among those working 20 hours or more. This small difference suggests that holding a part-time job does not substantially affect academic performance. Similarly, Table 4 shows that female students have a marginally higher average GPA (3.09) than male students (3.03), but the gap is minimal, indicating that gender alone does not meaningfully predict college success. In contrast, the relationship between ACT scores and GPA appears stronger. According to Table 5, students with above-average ACT scores have a mean GPA of 3.15, while those with below-average scores average 2.99. This clearer difference suggests that prior academic preparation, as measured by ACT performance, may be more closely linked to college achievement than either work hours or gender.
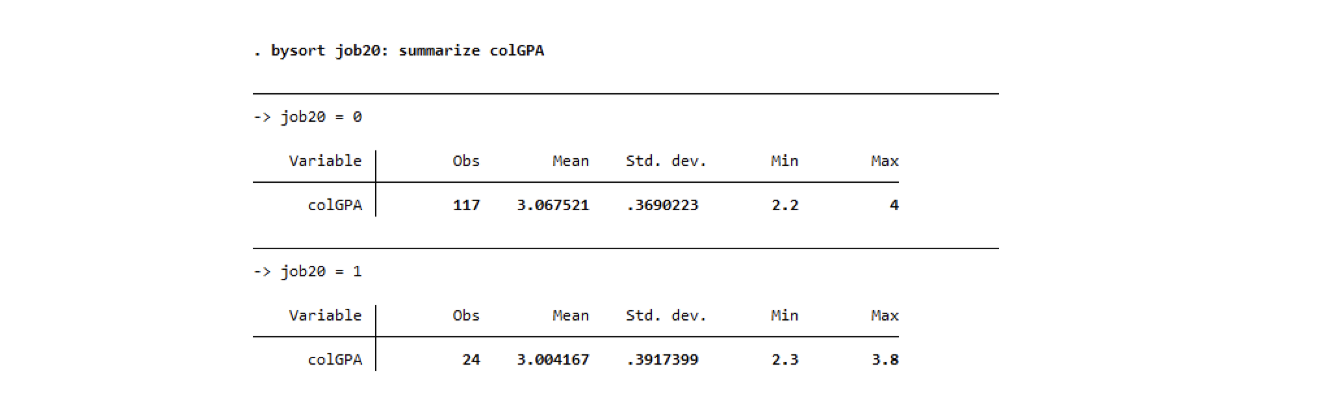
Table 3. Conditional statistics of college GPA on Job20
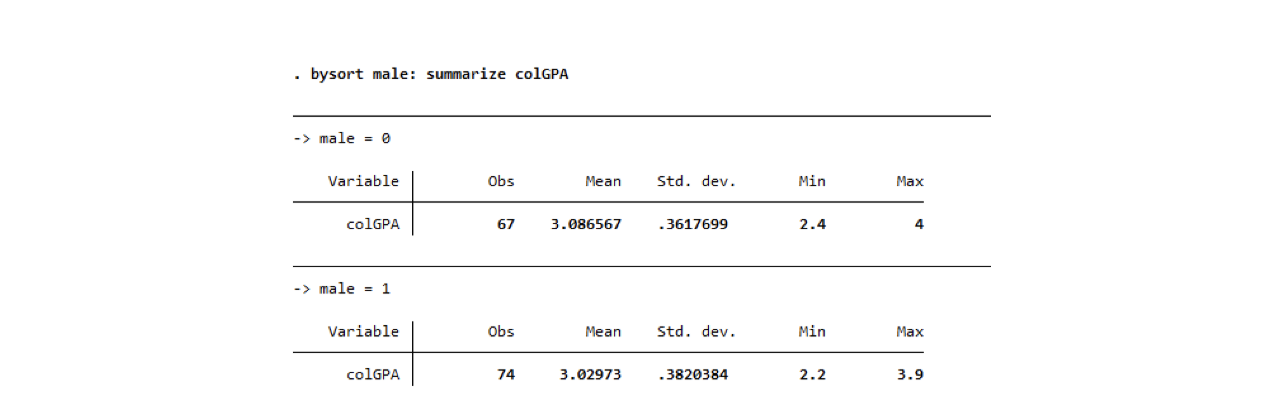
Table 4. Conditional statistics of College GPA on Male

Table 5. Conditional statistics of College GPA on HighACT
Table 7 introduces the dummy variable highGPA, which was constructed to categorize students based on whether their college GPA (colGPA) falls above or below the sample mean. Specifically, we set highGPA = 0 if a student’s GPA is below the mean value of 3.0567, and highGPA = 1 if it is above the mean. This new variable simplifies the interpretation of results by allowing comparisons between students with higher-than-average and lower-than-average GPAs. It serves as a useful tool for examining relationships between academic performance and other explanatory variables, such as gender, attendance, and study habits.

Table 6. Correlation between college GPA and lectures skipped

Table 7. Correlation between college GPA and alcohol
As seen in Table 8 below, the conditional probabilities reveal the relationship between gender and academic performance. Among male students, 39.19% have a high GPA, while 60.81% do not. In comparison, 43.28% of female students have a high GPA, and 56.72% do not. These results indicate that female students in this sample are slightly more likely to achieve higher GPAs than male students. The difference is small, suggesting that while gender may play a minor role, other factors such as attendance, work hours, and study habits likely have a stronger influence on academic performance.
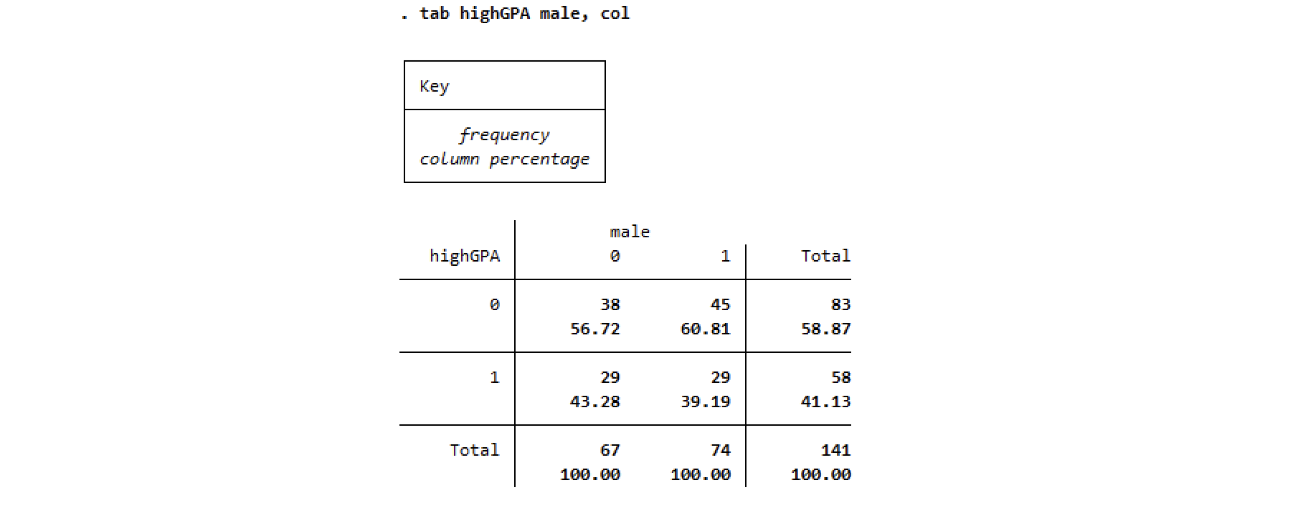
Table 8. Conditional and marginal probabilities table
Figure 2 shows a weak, slightly negative correlation between college GPA and the number of classes skipped per week. As the average number of classes skipped increases, college GPA seems to slightly decrease, however there is large variation from where the line of best fit would lie.
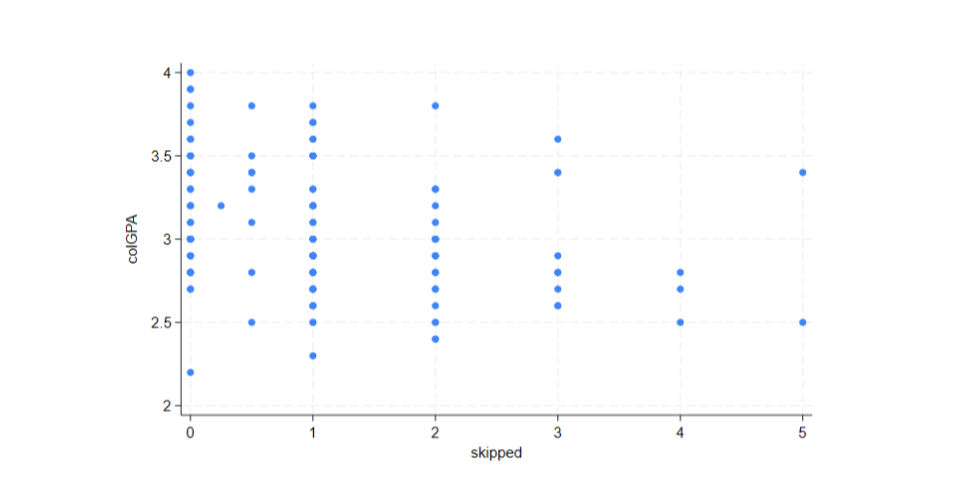
Figure 2. College GPA vs Skipped scatter plot
On the other hand, Figure 3 shows no correlation between college GPA and alcohol consumption. There does not appear to be a relationship between the number of days of alcohol consumption per week and college GPA. The points are spread out across the scatter plot.
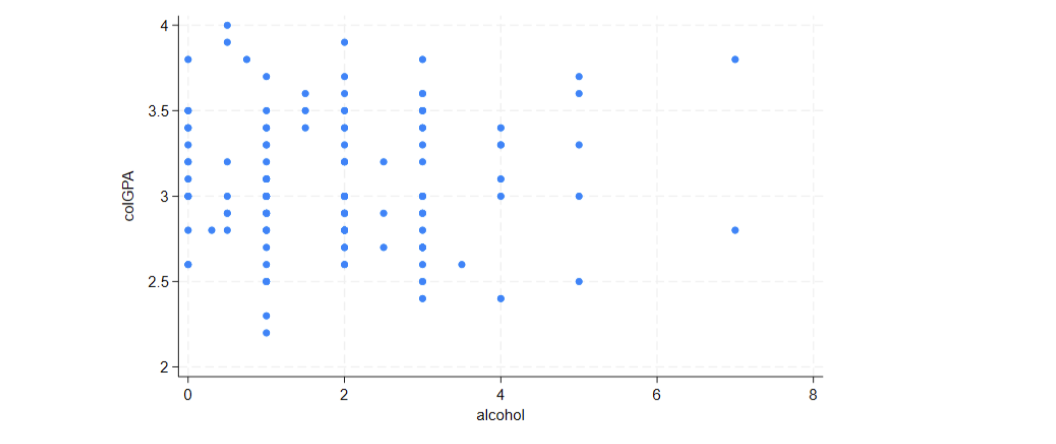
Figure 3. College GPA vs Alcohol scatter plot
In Table 9, we conducted a hypothesis test with the null hypothesis that the means of college GPA conditional on the values of the dummy variable male are equal. We ran a tw0-tailed t test with H0: difference = 0 and Ha: diff != 0. Because Pr(|T| > |t|) = 0.3672, we fail to reject the null hypothesis that the two means are different. Based on this t test, average college GPA for males and females is not statistically different.
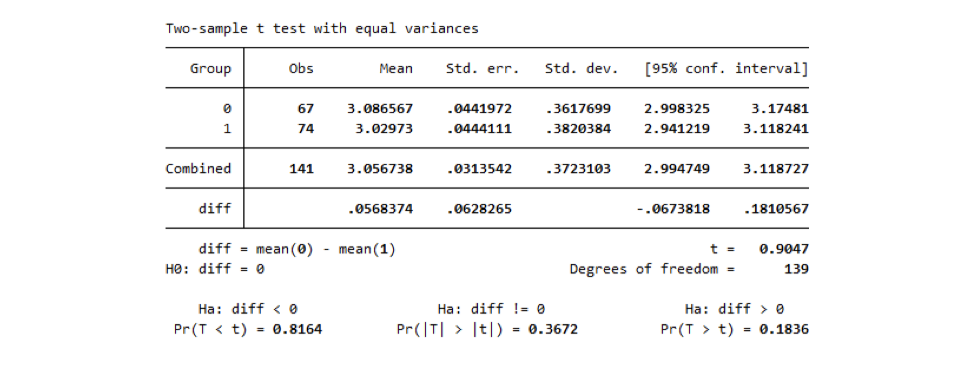
Table 9. Two-tailed t test of College GPA conditional on Male
Our research question investigates the effect of missing class, having a job, alcohol consumption, and ACT score on a student’s college GPA, and therefore the main multivariate regression used is: regress colGPA skipped alcohol job20 male highACT. This regression shows if there is a statistically significant effect of each of these variables in students’ college GPA, and their coefficients determine the magnitude of the effect. Before running the regression, we predict that the coefficient of the variables skipped alcohol and job20 would be negative, since missing classes, alcohol consumption and being occupied by a job would negatively impact a student’s academic performance and thus decrease their college GPA. On the other hand, highACT should have a positive coefficient since having an above average grade on standardized tests could mean a better performance academically and consequently a higher college GPA.
We expect that the most statistically significant variable is the number of classes skipped per week, due to the fact that class attendance is the most fundamental place for students to effectively learn, so by missing lectures, students are unable to fully learn their class contents and have a good performance academically, which is directly mirrored onto their GPA. We predict that skipped and job20 would be causal to having a low college GPA, since these factors both make it difficult for students to learn and be present in class. Being male or female is most probably correlational, since it usually changes student’s social events and how they spend their free time, which can impact their grades. However, there are other factors that are not in our regression, or even in our dataset, that could affect our variables, such as socioeconomic status, cultural background, student’s majors, and many other omitted variables. For example, a student's major can lead us to underestimate their college GPA, due to the fact that harder courses usually lead to lower grades, and vice versa.
The estimated regression model is:
y_hat = 3.0863 - 0.1028x1 + 0.0329x2 - 0.0657x3 - 0.0675x4 + 0.1614x5.
The coefficient for the variable skipped is -0.1028, meaning that every one class skipped is associated with a -0.1028 decrease in college GPA. This coefficient is significant at the 1% significance level, meaning that there is a low probability that the observed relationship is due to random chance. The coefficient for alcohol is 0.0329, meaning that every one day of the week a student consumed alcohol is associated with a 0.0329 increase in college GPA. The p-value for this coefficient is 0.179, indicating that it is not statistically significant, and that there is not strong evidence that the coefficient is different from zero. The coefficient for the variable job20 is -0.0657, meaning that working 20 or more hours per week is associated with a 0.0657 decrease in college GPA. This coefficient is not statistically significant, meaning that there is a high probability that the observed relationship is due to random chance. The coefficient for variable male is -0.0675, meaning that being male is associated with a 0.0675 decrease in college GPA compared to females. This coefficient is not statistically significant, indicating that there is a high probability that the observed relationship is due to chance. The coefficient for the variable highACT is 0.1614, indicating that having an above average ACT score is associated with a college GPA that is 0.1614 higher compared to students with a below average ACT. This coefficient has a p-value of 0.009, indicating that it is statistically significant at the 5% significance level, and that there is sufficient evidence that the coefficient is different from zero.
The R2 value is 0.1342, which means that the proportion of variance in college GPA can be explained by the variables in our regression model: skipped, alcohol, job20, male, and highACT. We can conclude that skipping classes is negatively associated with college GPA, and having an above average ACT score is positively associated with college GPA. The variables skipped and highACT are both statistically significant, while the other variables in our regression analysis are not, so we cannot conclude any relationship between college GPA and alcohol consumption, working more than 20 hours a week, or gender. We believe that our results are likely to hold in the entire population, because we have a fairly large sample size and the variables skipped and highACT are statistically significant. Furthermore, most colleges around the U.S. are similar in terms of campus life, academic coursework, and overall student population.
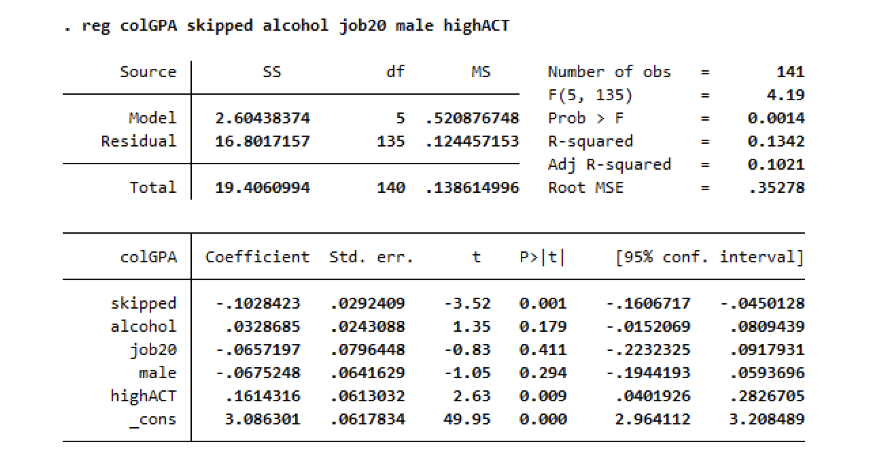
Table 10. Regression analysis results
Our results show that skipping classes and having an above-average ACT score are the only variables significantly associated with college GPA. Skipping one additional class per week is linked to a decrease in GPA, while students with higher ACT scores tend to earn slightly higher GPAs. Alcohol consumption, working 20 or more hours per week, and gender do not show statistically significant effects, so we cannot conclude that they are related to GPA in our sample. These findings suggest that attendance and prior academic preparation are the strongest predictors of academic performance in our sample. However, because our analysis is correlational, we cannot rule out the influence of factors not included in our dataset, such as motivation, study habits, or a student’s major, which may also affect GPA. Our conclusions align with the existing literature, which similarly finds strong relationships between attendance, standardized test scores, and college outcomes, and weaker evidence for variables like work hours or alcohol use. The policy implications of our findings suggest that universities could benefit from supporting class attendance and offering early academic resources to students who may be at risk of lower performance. For future research, incorporating additional variables, such as type of major, number of majors or minors, study habits, or socioeconomic background would help address omitted-variable bias and provide a clearer understanding of the factors that influence college GPA.
El Ansari, Walid, Christian Stock, and Colin Mills. “Is Alcohol Consumption Associated with Poor Academic Achievement in University Students?” International Journal of Environmental Research and Public Health, vol. 10, no. 11, 2013, pp. 4449–4462.
DeMartini, Christine. Attendance & GPA: Health as a Deciding Factor. The College of New Jersey, 2009.
Khalifa Al Hazaa, Abdel-Salam, Radwa Ismail, Chithira Johnson, Rusol Adil Naji Al-Tameemi.The effects of attendance and high school GPA on student performance in first-year undergraduate courses. 11 August 2021.